Geography
The municipality has a land area of 78.41 square kilometers or 30.27 square miles which constitutes 1.24% of Leyte’s total area. Its population as determined by the 2020 Census was 57,455. This represented 3.23% of the total population of Leyte province, or 1.26% of the overall population of the Eastern Visayas region. Based on these figures, the population density is computed at 733 inhabitants per square kilometer or 1,898 inhabitants per square mile.
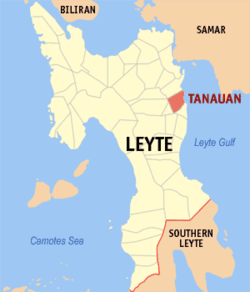
Tanauan, Leyte
Administrative divisions
Tanauan is politically subdivided into 24 barangays. Each barangay consists of puroks while some have sitios.
| Barangay | Population percentage (2020) | Population (2020) | Population (2015) | Change (2015‑2020) | Annual Population Growth Rate (2015‑2020) |
|---|---|---|---|---|---|
| Ada | 0.70% | 402 | 370 | 8.65% | 1.76% |
| Amanluran | 0.82% | 471 | 458 | 2.84% | 0.59% |
| Arado | 0.65% | 371 | 360 | 3.06% | 0.64% |
| Atipolo | 1.49% | 858 | 771 | 11.28% | 2.28% |
| Balud | 0.46% | 267 | 262 | 1.91% | 0.40% |
| Bangon | 1.45% | 832 | 799 | 4.13% | 0.86% |
| Bantagan | 0.75% | 429 | 429 | 0.00% | 0.00% |
| Baras | 0.75% | 429 | 415 | 3.37% | 0.70% |
| Binolo | 0.72% | 414 | 369 | 12.20% | 2.45% |
| Binongto-an | 0.89% | 513 | 522 | -1.72% | -0.37% |
| Bislig | 3.66% | 2,103 | 3,217 | -34.63% | -8.56% |
| Buntay | 1.64% | 942 | 1,022 | -7.83% | -1.70% |
| Cabalagnan | 0.83% | 477 | 461 | 3.47% | 0.72% |
| Cabarasan Guti | 0.71% | 407 | 398 | 2.26% | 0.47% |
| Cabonga-an | 0.65% | 376 | 306 | 22.88% | 4.43% |
| Cabuynan | 5.34% | 3,070 | 3,350 | -8.36% | -1.82% |
| Cahumayhumayan | 1.46% | 836 | 877 | -4.68% | -1.00% |
| Calogcog | 2.02% | 1,163 | 960 | 21.15% | 4.12% |
| Calsadahay | 1.63% | 935 | 880 | 6.25% | 1.28% |
| Camire | 1.04% | 598 | 555 | 7.75% | 1.58% |
| Canbalisara | 1.23% | 706 | 647 | 9.12% | 1.85% |
| Canramos | 5.78% | 3,320 | 3,634 | -8.64% | -1.88% |
| Catigbian | 0.37% | 213 | 305 | -30.16% | -7.28% |
| Catmon | 1.99% | 1,146 | 882 | 29.93% | 5.67% |
| Cogon | 1.27% | 731 | 621 | 17.71% | 3.49% |
| Guindag-an | 1.57% | 902 | 1,030 | -12.43% | -2.75% |
| Guingawan | 1.08% | 622 | 609 | 2.13% | 0.45% |
| Hilagpad | 0.70% | 402 | 287 | 40.07% | 7.35% |
| Kiling | 2.03% | 1,166 | 1,177 | -0.93% | -0.20% |
| Lapay | 1.22% | 702 | 653 | 7.50% | 1.53% |
| Licod | 2.03% | 1,169 | 1,306 | -10.49% | -2.31% |
| Limbuhan Daku | 1.05% | 605 | 514 | 17.70% | 3.49% |
| Limbuhan Guti | 1.37% | 788 | 652 | 20.86% | 4.07% |
| Linao | 0.85% | 489 | 429 | 13.99% | 2.79% |
| Magay | 1.27% | 728 | 587 | 24.02% | 4.64% |
| Maghulod | 0.93% | 533 | 471 | 13.16% | 2.64% |
| Malaguicay | 2.08% | 1,193 | 1,145 | 4.19% | 0.87% |
| Maribi | 2.34% | 1,343 | 966 | 39.03% | 7.18% |
| Mohon | 2.00% | 1,147 | 1,240 | -7.50% | -1.63% |
| Pago | 6.94% | 3,989 | 1,733 | 130.18% | 19.18% |
| Pasil | 0.71% | 410 | 340 | 20.59% | 4.02% |
| Pikas | 1.25% | 717 | 735 | -2.45% | -0.52% |
| Sacme | 3.60% | 2,068 | 547 | 278.06% | 32.30% |
| Salvador | 2.19% | 1,259 | 1,224 | 2.86% | 0.60% |
| San Isidro | 1.68% | 966 | 978 | -1.23% | -0.26% |
| San Miguel | 2.35% | 1,351 | 1,442 | -6.31% | -1.36% |
| San Roque | 6.16% | 3,541 | 5,032 | -29.63% | -7.13% |
| San Victor | 2.02% | 1,158 | 1,159 | -0.09% | -0.02% |
| Santa Cruz | 1.27% | 732 | 820 | -10.73% | -2.36% |
| Santa Elena | 2.15% | 1,234 | 1,193 | 3.44% | 0.71% |
| Santo Niño Poblacion | 6.52% | 3,747 | 3,549 | 5.58% | 1.15% |
| Solano | 1.00% | 572 | 566 | 1.06% | 0.22% |
| Talolora | 1.48% | 851 | 758 | 12.27% | 2.47% |
| Tugop | 1.85% | 1,062 | 1,009 | 5.25% | 1.08% |
| Tanauan Total | 57,455 | 55,021 | 4.42% | 0.92% | |